
A note before you start
The Decision Rights Mapper is released as a free, open tool under Creative Commons Attribution 4.0. That openness is intentional, and it carries a corresponding responsibility for anyone who uses or distributes the tool.
This is a reflection instrument for teachers. It was designed with care to resist becoming a surveillance or evaluation tool. No identifiers are collected. Individual maps stay private to the teacher unless they choose to share them. Team aggregates do not display until enough submissions exist that individual placements cannot be reverse-engineered. None of those design choices can fully prevent misuse. A principal could ask teachers to share their maps. A district could try to use aggregate data as accountability evidence. A coach could run a session looking for who in the room is “the problem.” None of these are what the tool is for, and all of them are within technical reach of anyone with a copy.
If you are running a session with this tool, whether as a teacher, a coach, a facilitator, or an administrator, you are responsible for ensuring participation is genuinely voluntary, the data is not used against participants, and the conversation stays in the spirit of reflection rather than evaluation. If you are not in a position to make those guarantees in your context, please don’t use the tool with your group. Individual mapping, which produces no data anyone else sees, is always available as an alternative.
Why this tool exists
If you ask a teacher who decides what gets taught in their classroom, the answer depends on which teacher you ask and which decision you mean. A high school physics teacher with twenty years in the same district probably decides for themselves how to introduce angular momentum. A first-year teacher in an elementary building using an adopted reading program probably reads from a script. A middle school social studies teacher in a state that has recently passed legislation about how history can be discussed may not know which of the things they used to do are still legal.
Most teachers operate inside a thicket of overlapping authority. Some of it is legal (state standards, federal regulations). Some of it is contractual (district policy, collective bargaining). Some of it is technical (a learning management system that enforces a particular structure). Some of it is informal (what the teacher next door is doing, what the principal seems to want, what the parents have come to expect). The teacher’s professional authority operates somewhere inside this thicket, but exactly where varies decision by decision and is rarely visible all at once.
The Decision Rights Mapper is a reflection tool that makes the pattern visible. A teacher works through 35 classroom decisions and places each one at the locus where the final say currently rests. The output is a picture of the teacher’s situation that is hard to assemble any other way: a clear view of which decisions still belong to them, which have moved elsewhere, and where the official locus of a decision differs from where the decision actually gets made.
The tool produces no scores. It does not rate the teacher. It makes no claim about whether the teacher’s current situation is good or bad. Two teachers with identical maps may feel very differently about what the maps show, and both responses are legitimate. The tool’s job is to produce the picture, not to tell the teacher what to do with it.
What the tool is built around
The intellectual ground for the tool comes from a few overlapping conversations, and it tries to take all of them seriously.
The most direct influence is the work of Michael Apple, the educational theorist whose books on ideology, curriculum, and the politics of school knowledge have shaped how a generation of researchers think about who decides what counts as legitimate knowledge in classrooms. Apple uses the term deskilling to describe a process in which work that used to require professional judgment gets broken into pieces, each of which can be performed by following predetermined steps. A scripted curriculum that tells teachers what to read aloud, when to pause for student responses, and what to write on the board is deskilling translated into educational practice. Apple’s argument is not that all standardization is harmful or that all teacher freedom is valuable. It’s that we should be honest about what is happening, who is gaining authority and who is losing it, and what kind of professional teaching becomes when the teacher’s intellectual work is mostly compliance.
Apple’s frame is not the only one worth holding. Writers working from self-determination theory and from the high-quality instructional materials movement argue that strong adopted curricula and instructional structures can raise the floor for under-prepared teachers without lowering the ceiling for strong ones, provided teachers retain meaningful adaptive authority. The New Teacher Project’s research has made the case that students often work below their grade level partly because teachers, left fully to their own devices, sometimes select materials that are easier than what students could handle. From that frame, more curricular structure helps rather than hurts.
The tool is designed to work for users coming from either frame. A teacher who completes the map and concludes “this is about right, the system I work in is making the right calls for me” is using the tool correctly. A teacher who completes the map and concludes “I have lost more professional authority than I realized” is also using the tool correctly. The map is descriptive. What the user does with the description is up to them.
What the map insists on is honesty in the description. That commitment shapes one design choice in particular, drawn from the work of Gert Biesta. Biesta distinguishes between input regulation, which means direct prescription of what teachers do (scripted lessons, mandated curricula, pacing guides), and output monitoring, which means indirect steering through accountability measures (benchmark tests, evaluations, building report cards). Both move authority away from the teacher, but they leave different traces. Teachers experience the gap between official and actual locus of decisions all the time. A state standard may technically permit curriculum flexibility while the building’s pacing guide, benchmark tests, and coach feedback effectively move the decision elsewhere. The teacher is operating under output monitoring that functions as input regulation. The tool surfaces this gap directly: after placing each decision at the locus where it actually rests, you can flag any decision where the official locus is different and specify what the official locus is. The flagged gaps are often the most interesting findings on the map.
The decision taxonomy itself draws on the small body of teacher autonomy measurement research that goes back to the 1970s. Items about texts, sequence, time allocation, classroom assessments, grading, professional development, and physical arrangement are recognizable to anyone familiar with that literature. The taxonomy also extends past where those instruments stopped, into territory that critical pedagogy frames bring to the foreground: whose histories appear in the classroom, what languages are welcome, which student work gets displayed, what daily routines teach about time and authority and work. The fuller list of references appears at the end of this page.
What you can expect
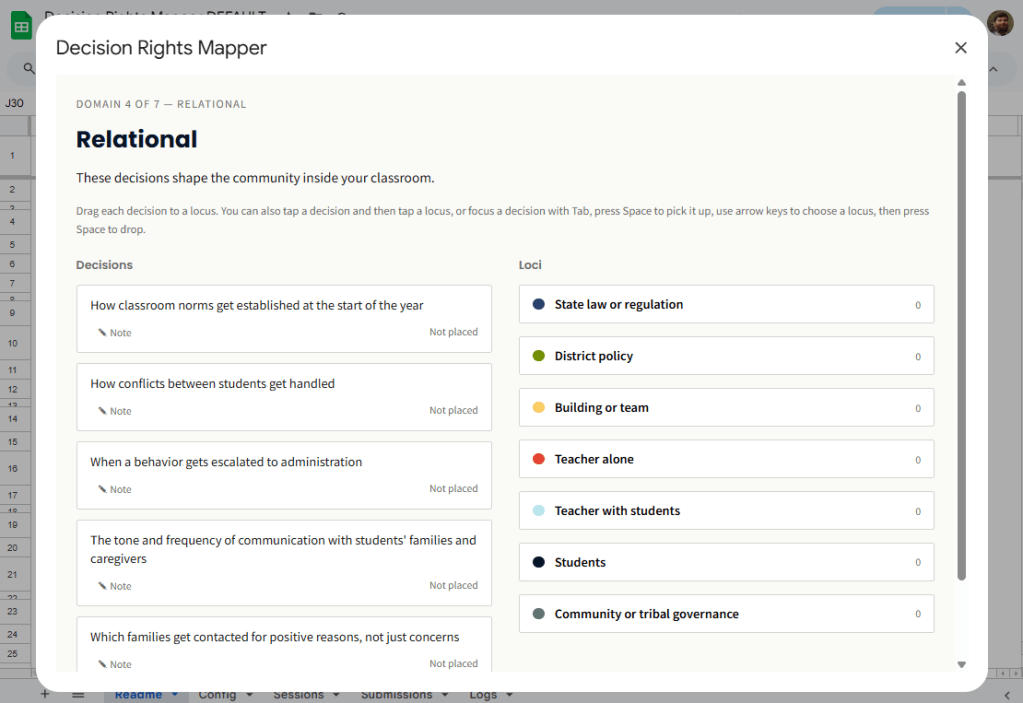
The interaction is straightforward. After a brief framing screen and an optional context question, you work through seven domains: curricular, pedagogical, assessment, relational, environmental, hidden curriculum, and professional labor. Each domain contains four to seven decisions, for a total of 35 items. For each decision, you place the card at the locus where the final say currently rests. The seven loci are state law or regulation, district policy, building or team, teacher alone, teacher with students, students, and community or tribal governance.
The seventh locus, community or tribal governance, will not apply to most users. It’s included for teachers in Bureau of Indian Education schools, tribal grant schools, reservation-border public schools, Hutterite colony schools, and other contexts where governance authority does not run cleanly through the state-district-building hierarchy that most U.S. public school structures assume.
After the actual-locus pass, you have an optional second pass: flag any decisions where the official locus is different from where you placed it, and specify what the official locus is. For most decisions on most maps, the official and actual loci are the same. The interesting findings are usually in the minority of items where they differ.
There is also an optional cluster of three additional items at the end, focused on what you bring of yourself into the classroom: how much of your personal identity you make visible to students, which topics in the news or public life you will discuss, what you are willing to advocate for publicly as a teacher. These items are presented separately because they are often more charged than the core items. Skipping them is fine.
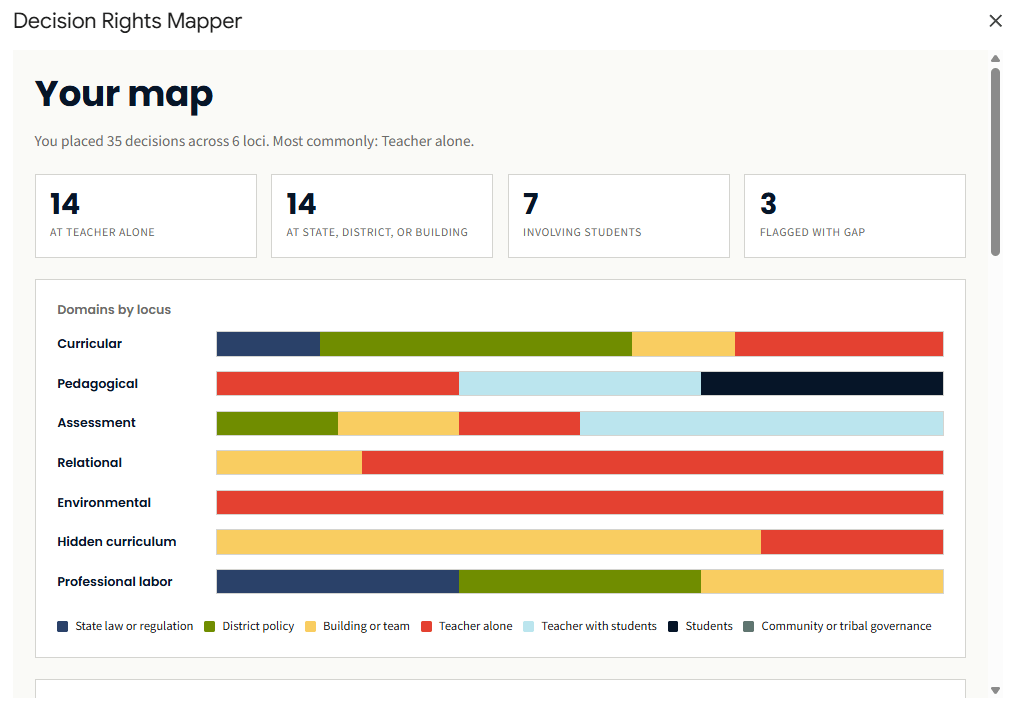
At the end, the tool produces a visualization. The primary view is a set of stacked horizontal bars, one per domain, segmented by locus. A teacher whose curricular bar is heavily state-and-district and whose pedagogical bar is heavily teacher will see the asymmetry immediately. A secondary item-grid view lets you inspect individual placements, and reflection prompts adapted to the shape of the map invite you to interpret what you see.
The whole thing takes 15 to 25 minutes if you do it without the optional cluster, a bit longer if you engage the cluster and add notes on items that warrant context.
What the tool is not
This is a reflection instrument, not a diagnostic. It will not tell you whether your classroom is autonomous enough or appropriately structured. You’ll get a clear view of where decisions rest, and you’ll draw your own conclusions.
It is also not an advocacy instrument for a particular position. The taxonomy was designed to work for teachers across the political spectrum. A teacher who places “what goes on the walls” with district administration because the district mandates specific posters is making the same kind of locus observation as a teacher who places it with themselves because they have full latitude. The tool does not tell either teacher which arrangement is correct.
It is not a research instrument suitable for academic publication or organizational benchmarking. It’s built for individual and team use, not for cross-building, cross-district, or cross-state comparison. The data it produces is the team’s data, used by the team for the team’s own purposes.
And it is not a replacement for conversation. The map is a starting point. The real work happens in the reflection a teacher does afterward, the conversation a team has with the aggregate, or the questions the map raises for a coach or facilitator. A team that completes the map and never talks about it has not used the tool.
Who this is for
This tool is built for teachers who suspect they have less professional authority than they used to and want a clearer picture before deciding what to do about it. It is also built for teachers who have plenty of professional authority and want to see how they have used it.
For teaching teams running professional learning communities, the team aggregate gives the group something concrete to work with that goes deeper than survey ratings without becoming an academic exercise. For instructional coaches and external facilitators, the map is a discussion starter that surfaces the structural conditions teachers operate under without making any single teacher the subject of the conversation.
Principals and curriculum directors may also find the tool useful, with a caveat. The map can help leaders understand how the policies they oversee are experienced by the teachers operating under them, but only in contexts where leaders can hold that understanding without using it as an evaluation instrument. The disclaimer at the top of this page applies with particular force to anyone in a supervisory role.
Teacher educators preparing pre-service teachers may also find a place for the tool. Working through the map can be a productive exercise for new teachers learning to think about the structural conditions of the profession they are entering, well before they’re operating inside those conditions themselves.
A note on context
The taxonomy was built primarily with teachers in the Great Plains region in mind: South Dakota, North Dakota, Nebraska, Iowa, Minnesota, Montana, Wyoming. That shaped certain assumptions. Many small rural districts. A high concentration of tribal nations and BIE schools. Faith communities running schools that operate by their own logic. Teacher shortages severe enough that emergency certification is common. Administrative structures often thinner than what the academic literature on school leadership assumes.
Teachers in other contexts may find some items resonate and some do not. A teacher in an urban public school will encounter different forms of regulation than a teacher in a rural district. A teacher in a charter network may find that the building-or-team locus is doing more work than expected because charter management organizations often consolidate decisions at the network level. A teacher in a private school may find that some decisions sit with parents and trustees in ways the locus categories do not quite capture. The tool is honest about being designed against a specific context, and it can be adapted (see “Make It Yours” below) for contexts the original taxonomy did not anticipate.
The intellectual foundations are not regional. The questions Apple raises about deskilling and official knowledge are as relevant in Brooklyn as in Buffalo Gap. But the texture of how those questions show up in a teacher’s day is shaped by where they teach, and the tool’s design is responsive to the texture of the Great Plains rather than pretending to be universal.
Quick Look
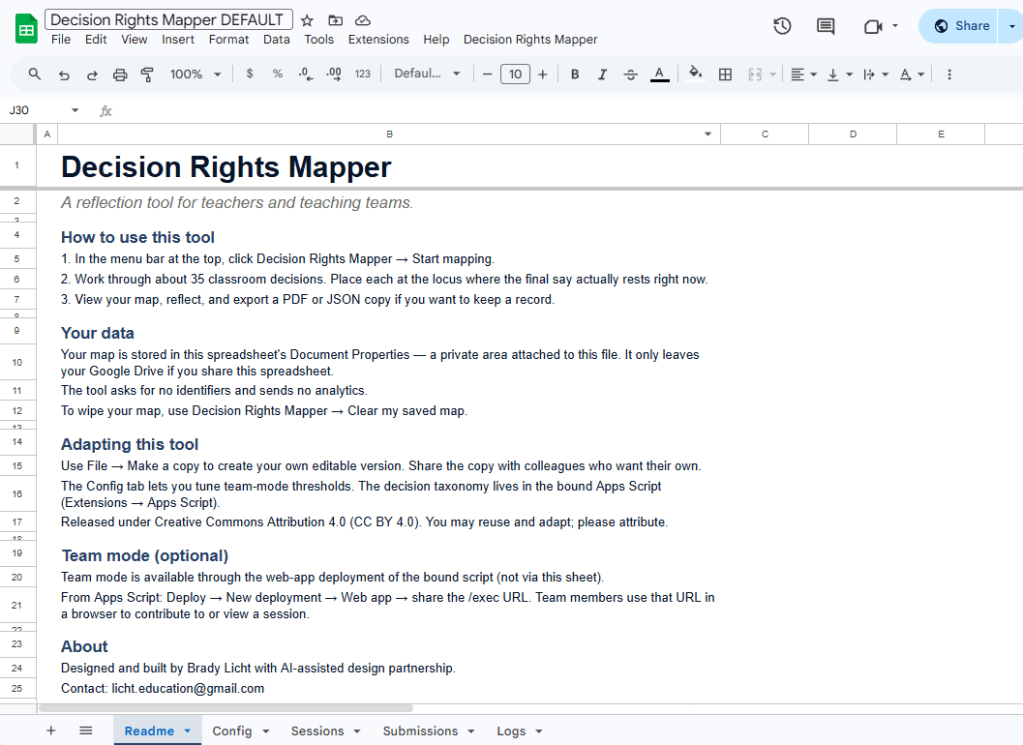
The tool runs as a modal dialog inside a Google Sheet. Most users never need to interact with the spreadsheet tabs directly. The sheet is just where the script lives and where the map is saved. The output view is where the visualization lives, and it’s the part most people will want to print or export for a follow-up conversation.
Get Started
Step one is making a copy of the master sheet.
Click the link, then click File → Make a copy. Give it a name (the default “Copy of Decision Rights Mapper” is fine) and choose where it lives in your Drive. The copy is yours. The script comes with it automatically. Anything you do in your copy stays in your Drive, and the original is unaffected.
If you’ve copied a Google Sheet before, this will feel familiar. If you haven’t, the important thing to know is that “Make a copy” is different from “Open” or “View.” You want a copy you own, not a window into someone else’s file.
Setup Guide
Once the copy is in your Drive, the setup is four short steps. The first time through, expect to spend about ten minutes total. After that, opening the tool takes one click.
1. Open your copy and authorize the script
When you open your copy of the sheet for the first time, look for the Decision Rights Mapper item in the menu bar at the top. Click it, then click any item underneath. Google will walk you through an authorization dialog the first time.
You’ll see a warning that says the app is unverified or unsafe. This warning is misleading but unavoidable for any Google Apps Script that hasn’t gone through Google’s verification process, which takes weeks and isn’t worth pursuing for a free educational tool. The script is open source, so if you want to read what it does before authorizing, click Extensions → Apps Script in your sheet and review the code.
To proceed, click Advanced, click Go to (your sheet name) (unsafe), then grant the requested permissions. The script asks for read and write access to that one spreadsheet, the ability to show dialogs and menus, and the ability to install a daily trigger if you later activate team mode. It does not ask for access to any other files in your Drive, and it does not call any external services.
A note for users on a Google Workspace domain: some enterprise admins restrict third-party Apps Script authorizations. If you can’t get past the authorization screen, your admin may need to allow it, or you can use a personal Google account instead.
2. Run setup once
After the menu reappears, click Decision Rights Mapper → Setup (run once). This creates the supporting tabs the tool needs: Readme, Config, Sessions, Submissions, and Logs. You can run setup again later if you want, but you don’t need to. It’s idempotent, which means running it twice does nothing harmful.
The Readme tab is the in-sheet documentation. It tells you how to launch the tool, where your data lives, and how to use team mode if you want it later. It’s worth a glance, but you don’t need to read it before mapping.
At this point, you should see the new tabs at the bottom of the sheet and a clean “Decision Rights Mapper” menu in the bar at the top.
3. Start mapping
Click Decision Rights Mapper → Start mapping. A modal dialog opens with the framing screen. Click Begin, optionally answer a few brief context questions (these are saved with your map but not required), and start working through the seven domains of decisions.
You can drag, click, or use the keyboard to place items. There’s a flag you can mark when the official locus differs from where the decision actually rests, which is often the most interesting data the map produces.
Plan on 15 to 25 minutes for a complete pass. If you need to step away, just close the modal. Your progress is saved at the end of each domain, so reopening Start mapping picks up where you left off.
4. View, export, or clear
When you finish the flow, the modal lands on the output view. You’ll see the stacked-bar visualization, the item grid, summary tiles, and reflection prompts.
From here, you can print to PDF (the modal prints in landscape and fits on one page in the browser print dialog), export the map as a JSON file for archival or for re-importing later, start a new map from scratch, or clear your saved map at any time using the menu item Clear my saved map.
The map is intended to be conversation fuel rather than just a screen. Most users export a PDF and bring it to a coach, an evaluator, a PLC meeting, or a personal journal entry. The JSON export is for users who want to compare maps over time or import a map into a different copy of the sheet.
If you stop here, you have a working tool. The rest of this guide is optional.
Make It Yours
Three customizations are common. The first two are safe for anyone. The third involves editing code and is meant for someone comfortable in the Apps Script editor.
Adjusting thresholds and session lengths. Open the Config tab in your sheet. Each row is a key/value pair you can edit directly. The settings cover things like default session length for team mode, the minimum number of submissions required before an aggregate displays, and whether the daily purge trigger runs. Changes take effect immediately and no code edit is needed. The privacy thresholds (minSubmissionsForAggregate and minSubmissionsPerItem) exist to prevent individual placements from being inferable in aggregate. You can lower them if you have a reason, but the defaults are conservative for a reason.
Editing reflection prompts. The reflection prompts at the end of the output view live in a file called data-reflections.html inside the script editor. To edit them, click Extensions → Apps Script, find that file in the file tree, and edit the JSON entries directly. Adding new prompts is safe. The selection algorithm picks prompts based on tags, so any new prompt you add will appear when its tags match a user’s map shape.
Editing the decision taxonomy. This is the deeper customization, and it’s where users adapting the tool for non-K-12 contexts (higher ed, museum education, district-office staff) will spend their time. The decision items live in two files that need to stay in sync: data-decisions.html (which the modal reads) and ItemData.js (which the facilitator-guide generator reads). Both files use the same item IDs and item text. Changing wording is safe, but changing item IDs will break any saved maps that reference them. If you fork the tool for a different context, this is the file pair to focus on. The rest of the codebase mostly takes care of itself once the items are right.
After any code change, the bound dialog (the menu inside the sheet) picks up your edits the next time the dialog opens. If you’ve also deployed the tool as a web app for team mode, you’ll need to publish a new version of the deployment for the web app to reflect your changes. The URL stays the same.
Adding Team Mode
Team mode lets a group of teachers contribute their individual maps to a single anonymous aggregate that everyone can view. It’s optional, and it requires one extra setup step: deploying the bound script as a web app. Anyone in the group can do this, but in practice it’s usually a PLC leader, an instructional coach, or whoever is most comfortable opening the Apps Script editor.
Before deploying, the disclaimer at the top of this page is worth re-reading. The person who deploys the sheet has access to all submissions made to that sheet. In a small group, the deployer can often work out who placed what if they want to. This is a real boundary. For most use cases the deployer is a coach or PLC leader who already has the trust required to handle the data responsibly, and the conversation is more important than the data anyway. But participants should know who has access before they submit.
To deploy, open the script editor with Extensions → Apps Script. In the top right, click Deploy → New deployment. Click the gear icon, choose Web app, and set “Execute as: Me” and “Who has access: Anyone.” Click Deploy. Google produces a URL ending in /exec. Copy it.
Two notes on the deployment settings. “Execute as: Me” is required because the script needs to write team submissions to the deployer’s spreadsheet. “Who has access: Anyone” sounds permissive, but the tool collects no identifiers, so there’s nothing to authenticate. Anonymous access is the right setting for what the tool actually does.
The /exec URL is what teammates use. The deployer keeps the spreadsheet, which is now the team’s session backend.
To run a session, share the /exec URL with teammates. They visit the URL in any browser and land on the tool’s web home page. From there, they can start a new team session (which generates a session code in the format DRM-YYMM-XXXX), join an existing session by entering a code, or view team results once the aggregate is available.
Once at least four teammates have submitted, anyone with the session code can view the aggregate. The aggregate shows distribution per item, conversation starters drawn from the data, and a download link for a server-generated facilitator guide (a 6 to 8 page PDF with a suggested 60 to 90 minute agenda).
The minimum-of-four threshold for the aggregate, and the per-item minimum of three, are privacy mechanisms. Below those thresholds, individual placements would be inferable. The defaults are configurable in the Config tab, but I’d encourage you to leave them alone unless you have a specific reason.
Privacy Posture
People will ask, so it’s worth being explicit about where data lives.
In individual mode, your map is stored in the Document Properties of your copy of the sheet. It does not leave Google Drive unless you share the sheet. Google can read the data the same way it can read all Drive content, but nobody else can. Not the tool author, not Compass Partners in Learning, not a researcher, not an admin elsewhere in the school.
In team mode, submissions are stored in the Sessions and Submissions tabs of the deployer’s spreadsheet. Submissions carry no identifier, only placements, optional notes, and a timestamp. The deployer can see all submissions but cannot tell from the data alone which submission came from which teammate, though as noted above, in small groups inference is possible. Expired sessions purge after 30 days by default.
The Logs tab records API calls (create_session, submit, get_aggregate, and so on) with a timestamp, success or failure, and a hash of the session code rather than the plaintext. Logs exist for diagnosing bugs, not surveillance.
The tool sends nothing to Google Analytics, no third-party services, and no email tracking. There is no telemetry.
Common Questions
- Where does my map live? In the Document Properties of your copy of the sheet. It travels with the sheet. If you share the sheet, anyone with access can see your map.
- If I close the modal mid-flow, do I lose my work? No. Save points are at the end of each domain. Reopening Start mapping resumes where you left off.
- Can I have more than one map at a time? Not in one sheet. Each copy holds one map. If you want a second, make a second copy of the sheet.
- Can my principal see my map? Only if you share the sheet with them, or if you give them an exported PDF.
- Why is there an “unsafe” warning when I authorize? It’s the standard Google warning for any Apps Script that hasn’t gone through Google’s verification process. The script is open source, so you can read it in Extensions → Apps Script before you authorize.
- I changed something and now it’s broken. Restore from your Google Drive version history (File → Version history → See version history), or copy the master sheet again from a known-good source.
- Can I delete team data after a session ends? Yes. From the deployer’s sheet, delete rows in the Sessions and Submissions tabs, or wait for the 30-day auto-purge.
Troubleshooting
If the menu doesn’t appear after first open, refresh the sheet. If it still doesn’t appear, open Extensions → Apps Script and run the onOpen() function manually one time. Apps Script sometimes drops the simple-trigger registration after long idle periods.
If the modal opens blank, the data files probably didn’t load. Check the script editor’s logs for any deploy errors. The files data-decisions.html, data-locus.html, and data-reflections.html all need to be present.
If you see a “State too large to save” error, you’ve added more notes than Document Properties can hold (each value caps at about 9 KB). Shorten your notes, or export the map as JSON and start fresh.
If the web app /exec URL returns an error after a code change, you need to redeploy. Go to Deploy → Manage deployments, click the edit pencil on your active deployment, and click New version. The URL stays the same; the version updates.
If a team session shows as “not found,” the session probably expired. Sessions purge after 30 days by default, and new ones are quick to create.
License and Attribution
The Decision Rights Mapper is released under Creative Commons Attribution 4.0 (CC BY 4.0). You can copy, adapt, share, and redistribute the tool, including for commercial use, as long as you provide attribution. Selling the tool itself is not in the spirit of the license.
The recommended attribution language for derivatives is: “Adapted from the Decision Rights Mapper by Brady Licht, licensed under CC BY 4.0.” A link back to the original is preferred but not required.
The license governs what you can legally do with the code and the taxonomy. The disclaimer at the top of this page governs what should be done with it. The two are separate. CC BY 4.0 does not require ethical use, but ethical use is what the tool is for.
Acknowledgments
This tool was built with substantial AI-assisted design partnership, working through the conceptual foundations, the decision taxonomy, the user flows, and the implementation patterns over several extended conversations. The intellectual content is mine to stand behind. The patient stress-testing of every design choice is what made it good enough to release.
Further Reading
The starting points below are organized by tradition. None of them are required reading to use the tool. They are listed for anyone who wants to go further into the questions the tool was built to surface.
- Critical pedagogy and the sociology of education.
- Michael Apple, Ideology and Curriculum (1979, 3rd ed. 2004) and Official Knowledge: Democratic Education in a Conservative Age (1993, 2nd ed. 2000).
- Paulo Freire, Pedagogy of the Oppressed (1968, 30th anniversary ed. 2000).
- Henry Giroux, Teachers as Intellectuals: Toward a Critical Pedagogy of Learning (1988).
- bell hooks, Teaching to Transgress: Education as the Practice of Freedom (1994).
- Culturally responsive, sustaining, and indigenous pedagogies.
- Gloria Ladson-Billings, “Toward a Theory of Culturally Relevant Pedagogy” (American Educational Research Journal, 1995).
- Lisa Delpit, Other People’s Children: Cultural Conflict in the Classroom (1995, updated edition 2006).
- Django Paris and H. Samy Alim, Culturally Sustaining Pedagogies: Teaching and Learning for Justice in a Changing World (2017).
- Luis Moll and colleagues, “Funds of Knowledge for Teaching” (Theory into Practice, 1992).
- Teacher autonomy measurement and classroom decision research.
- L. Carolyn Pearson and Brenda Hall, “Initial Construct Validation of the Teaching Autonomy Scale” (Journal of Educational Research, 1993).
- Pearson and Moomaw, “Continuing Validation of the Teaching Autonomy Scale” (2006).
- Isaac Friedman, “Teacher-Perceived Work Autonomy: The Concept and Its Measurement” (Educational and Psychological Measurement, 1999).
- Strong and Yoshida, “Teachers’ Autonomy in Today’s Educational Climate” (Educational Studies, 2014).
- Narayanan, Shields, and Delhagen, “Autonomy in the Spaces: Teacher Autonomy, Scripted Lessons, and the Changing Role of Teachers” (Journal of Curriculum Studies, 2023).
- Self-determination theory and reformist perspectives.
- Edward Deci and Richard Ryan, “Self-determination Theory and the Facilitation of Intrinsic Motivation, Social Development, and Well-Being” (American Psychologist, 2000).
- Mike Anderson, Creating Autonomy Within Fidelity (ASCD, 2024).
- Catlin Tucker, “From Scripted Compliance to Creative Engagement” (catlintucker.com, 2025). The New Teacher Project, The Opportunity Myth (2018).
- The regulatory frame.
- Gert Biesta, “Education, Accountability, and the Ethical Demand” (Educational Theory, 2004), for the input-regulation versus output-monitoring distinction that shapes the tool’s official-versus-actual layer.
Connect and Continue
If you run into a problem the troubleshooting section doesn’t cover, if you adapt the tool for a context I didn’t anticipate, or if you find that the taxonomy needs revision based on how it lands with your group, I’d like to hear about it. Reach out at licht.education@gmail.com.
For more articles, tools, and resources, visit bradylicht.com.
